
UL Procyon AI Image Generation:
UL Benchmark not only offers its 3DMark benchmark suite but also, UL Procyon, to meet the demand for Artificial Intelligence evaluation. This benchmark was chosen for its ease of implementation. The benchmark will generate 4 x 4 images and provide us with a score as well as a result in the form of the time, in seconds, required to generate an image. The software supports several AI inference engines depending on the GPU used.
We will therefore use the benchmark in Stable Diffusion 1.5 (FP16) mode. It is intended for mid-range GPUs. The test will create 16 images at a resolution of 512 x 512 in batches of 4. There is a test called Stable Diffusion XL (FP16), where 16 images will be created, at 1024 x 1024, in batches of 1.
As the program has just undergone a major update, we had to run all our cards again, including the RTX 5000 series. The timing was too tight to have time to retest them all, so it will be updated asap.
UL Procyon AI Text Generation :
The latest benchmark added to this test suite, AI Text Generation. The Procyon AI Text Generation Benchmark provides a more compact and easier way to repeatedly and consistently test AI performance with multiple LLM AI models. UL says it has worked closely with many AI software and hardware leaders to ensure that the benchmark tests take full advantage of the local AI accelerator of the systems used.
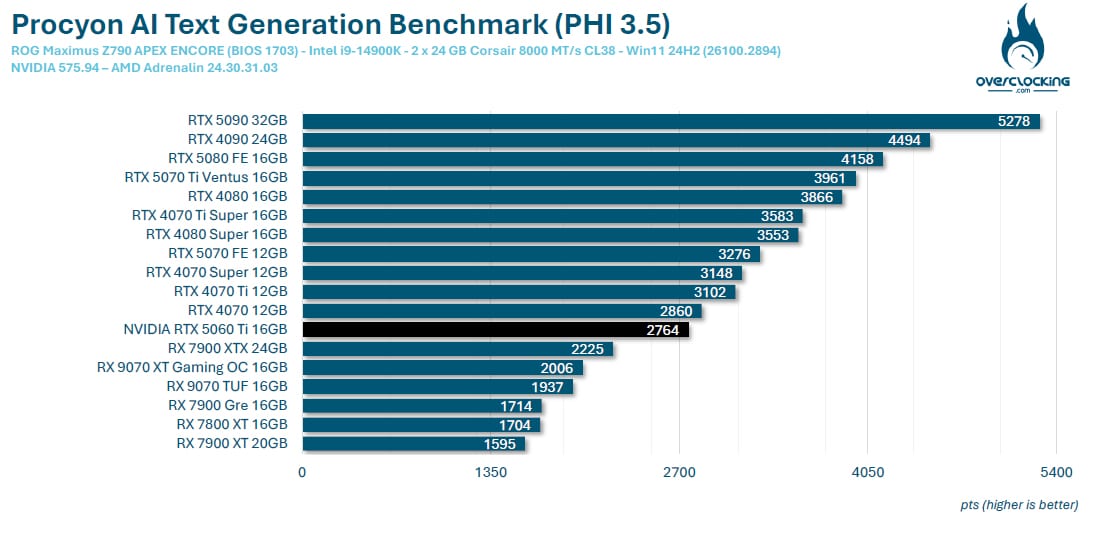
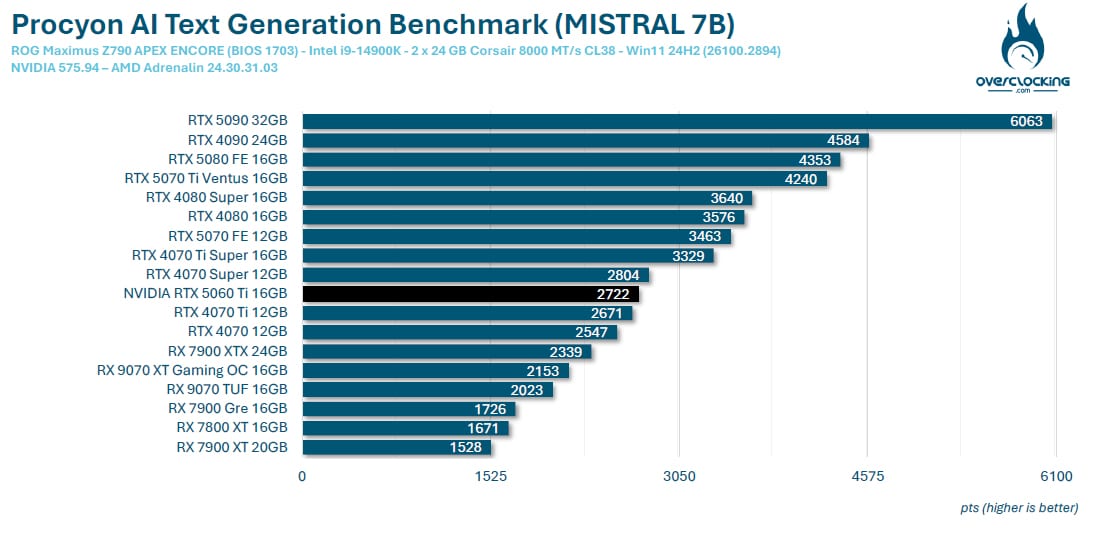
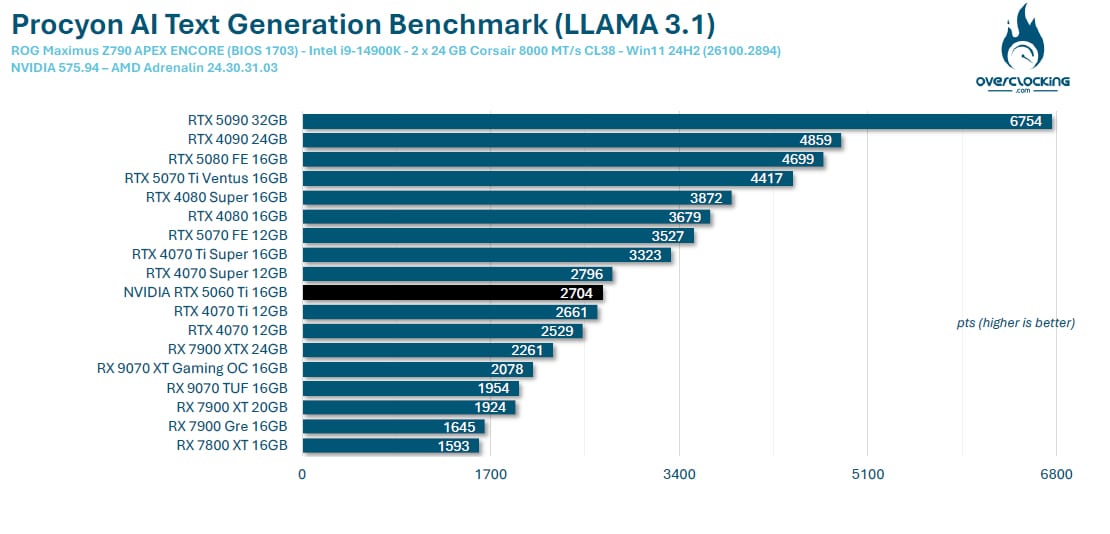
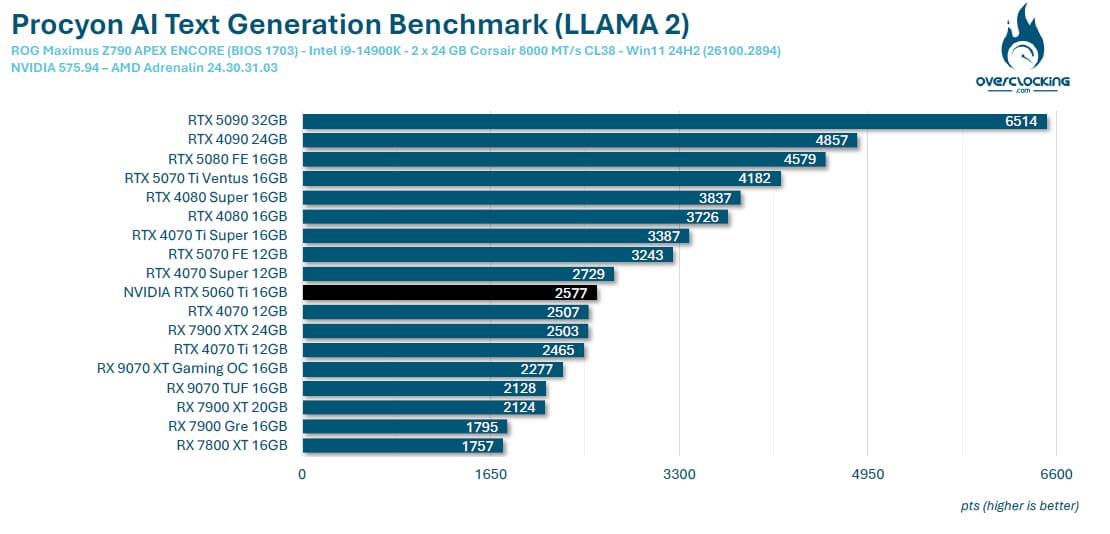
Performance has improved on the previous generation, since in this series of tests our MSI RTX 5060 Ti Gaming Trio OC 16 GB did better than the RTX 4070 FE and also the RTX 4070 Ti version!
V-Ray 6:
A new benchmark to add to those we use to test our graphics cards. The V-Ray 6 benchmark is produced by the Chaos company to enable users to quickly assess the rendering speeds of both your processor and your graphics card, which is why we’re adding it today. The great thing is that it’s free and can be downloaded directly by following this link. You can then compare your score directly with those below, or directly online on the Chaos page.
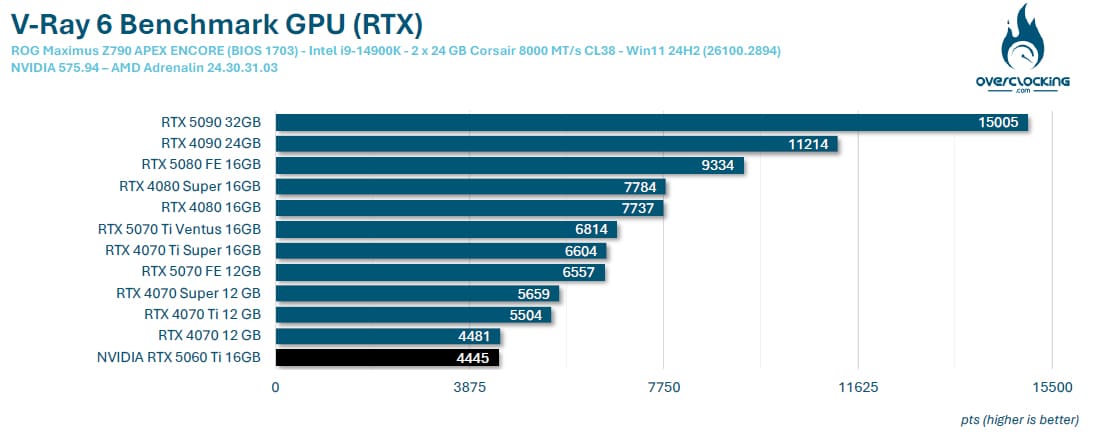
This benchmark has just been integrated into our tests, and we still have to run all our 1080p definition cards again. The difference here with the RTX 4070 FE is 36 points.

